Dec 4, 2015 Schools
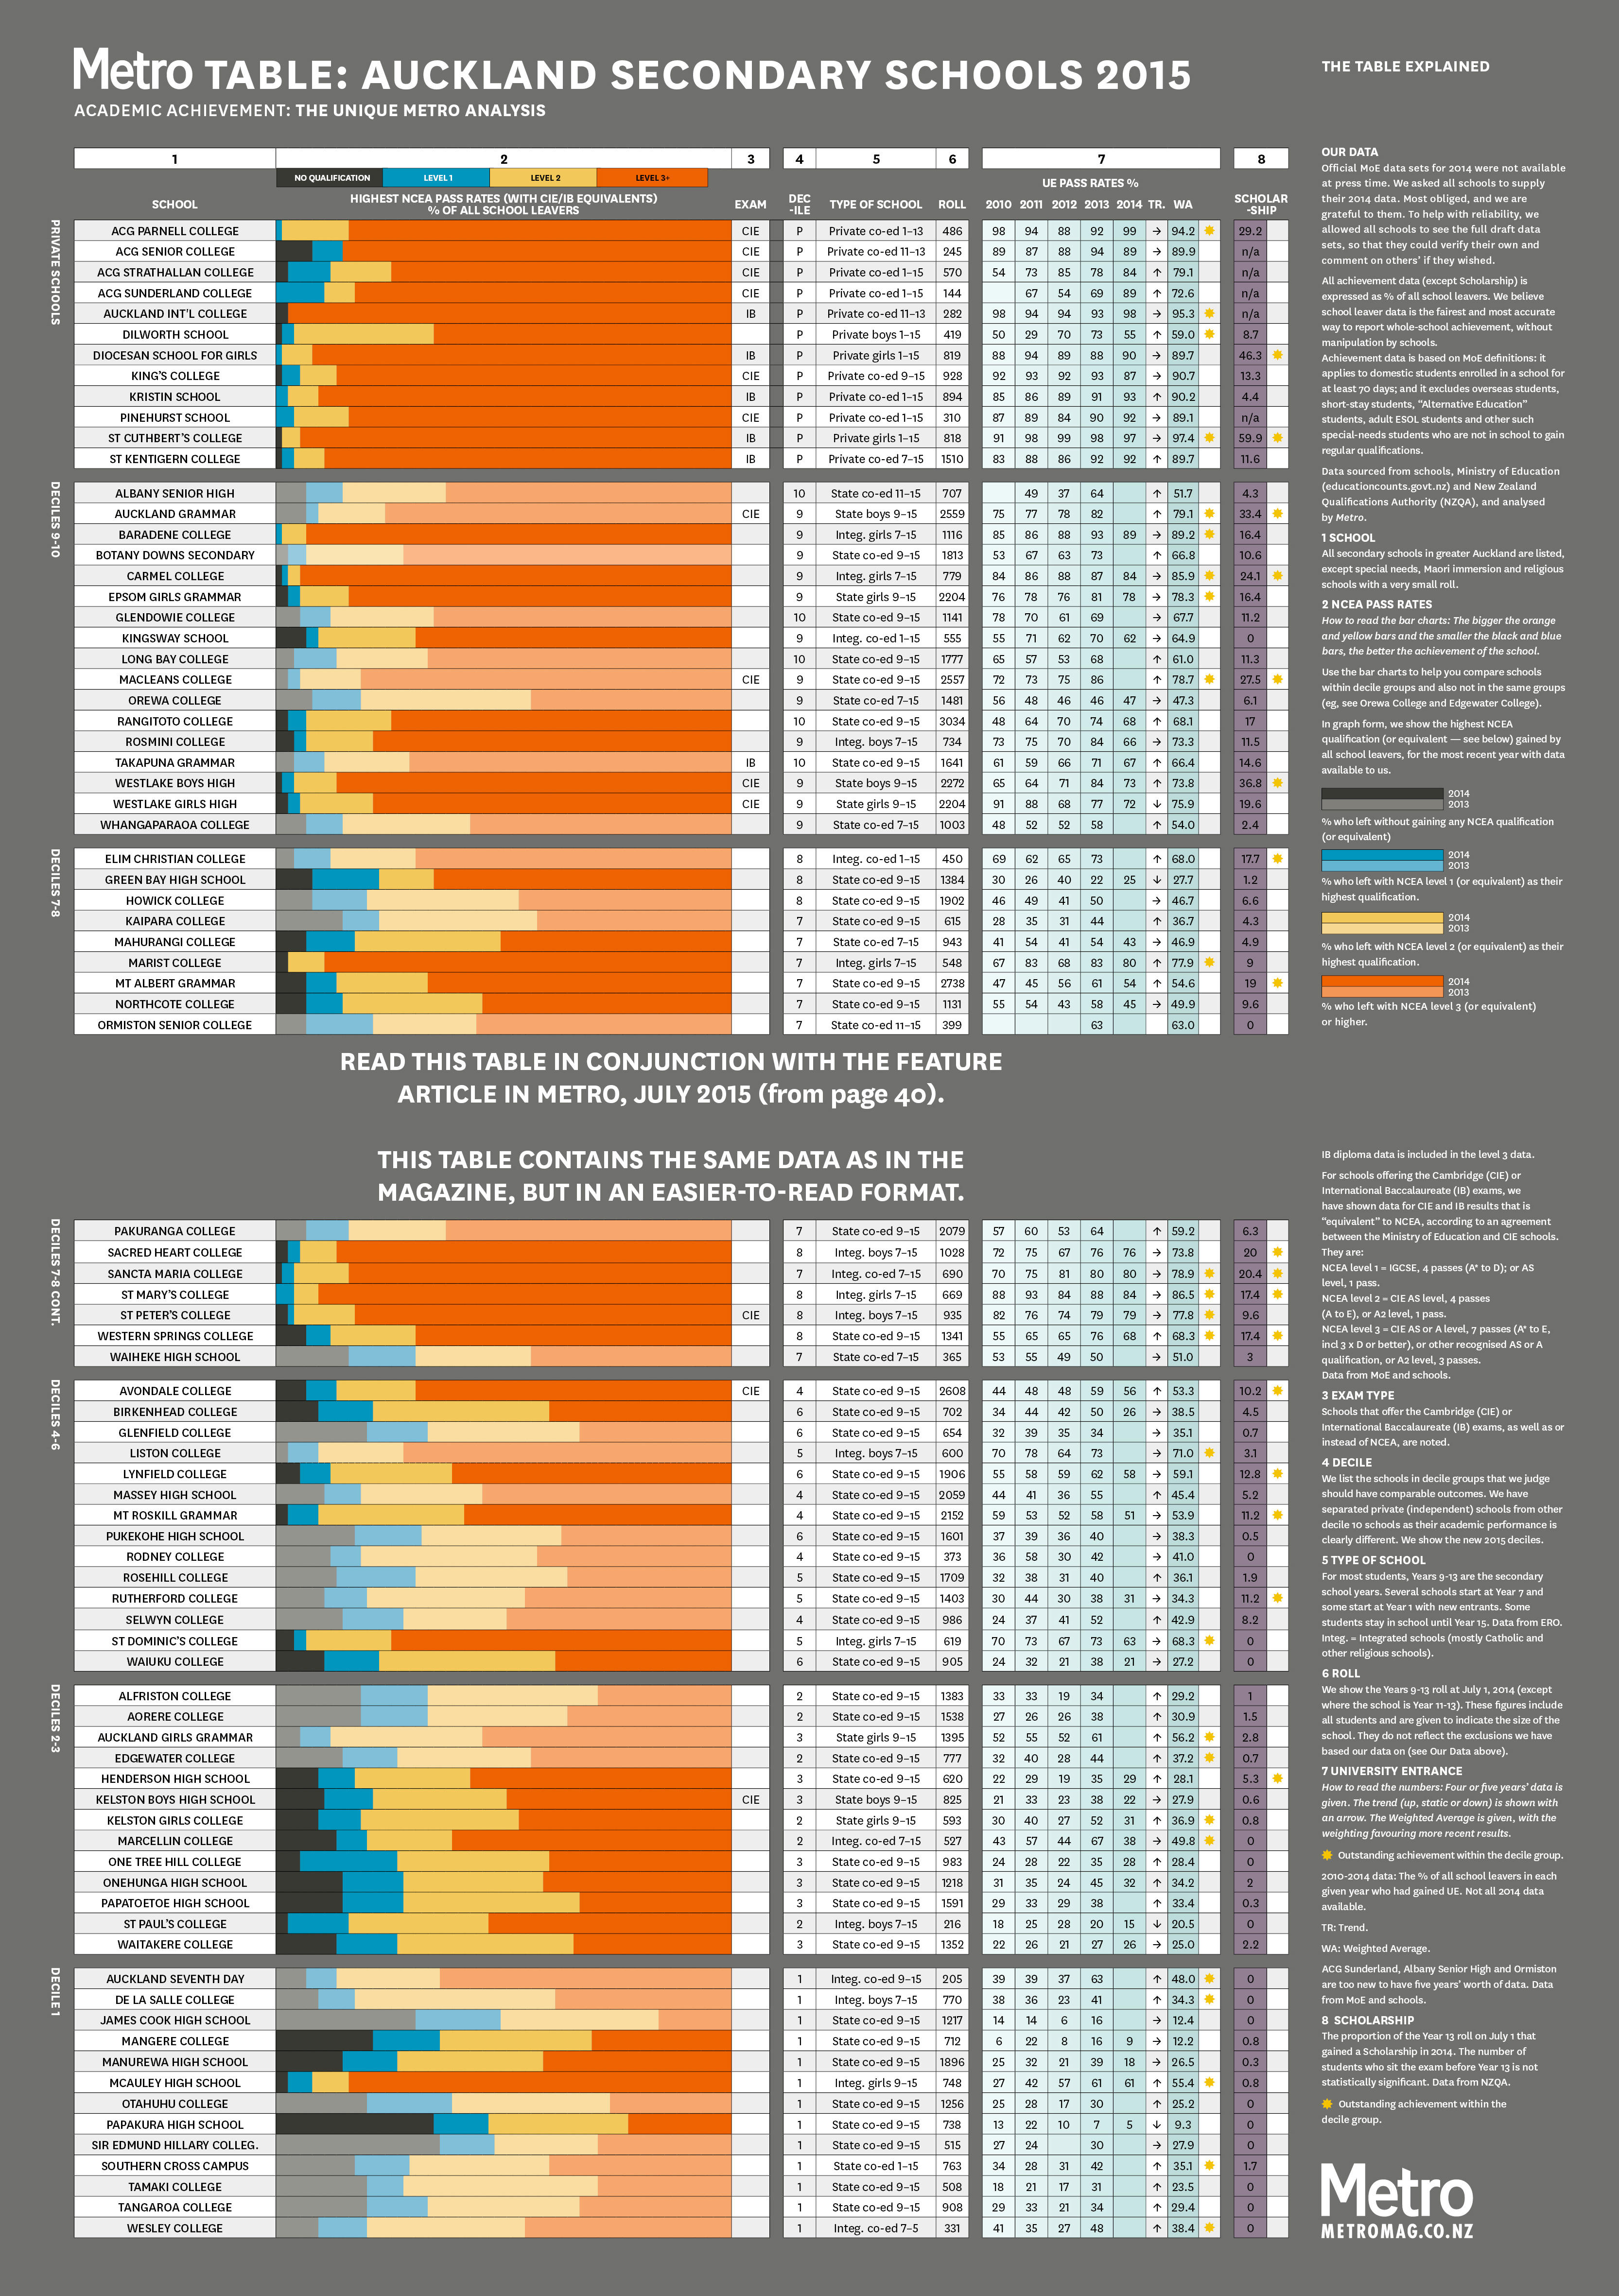
Click on image for full-size version. For notes to the table, see below.
Published in Metro, July 2015.
Statistics. It’s right to be worried. Statistics are collections of facts, supposedly arranged so meaning can be taken from them. Sadly, despite that clarity of purpose, statistics for schools are among the most difficult collections of facts you may ever encounter. Commonly, they’re misconceived and sometimes straight-out misrepresented. They can be incomplete, irrelevant and incomprehensible. They never give the whole story and sometimes they’re just plain wrong.
The statistical evidence we present suggests St Cuthbert’s College is the best school in Auckland. It also suggests McAuley High School is the best. And that Auckland International College is too. Our data also highlights the claims to greatness of several other schools, including but by no means limited to: Auckland Grammar, Western Springs, Avondale College and Mt Roskill Grammar, ACG Parnell College, Macleans College and a long list of Catholic schools including Baradene, Carmel, Liston, Marcellin, St Dominic’s and St Mary’s.
The message? There are many ways to calculate excellence.
Moreover, while those schools and others show outstanding achievements of varying kinds, it doesn’t follow that mid-table schools have a dull record. The general standard of secondary education in Auckland is high. If you visit Long Bay College, Northcote College, Manurewa High — and that’s a very brief sample list — you’ll find good things aplenty: exciting curricular and non-curricular programmes, skilled and dedicated staff, engaged students who look you in the eye with a bright confidence.
The best schools in Auckland?
St Cuthbert’s College has the best academic record of all schools in Auckland. It has the highest Scholarship pass rate (60 per cent of Year 13) and the highest weighted average of UE passes over the past five years (97.4 per cent of all school-leavers).
Auckland International College has the highest pass rate for the top level of NCEA or its equivalent (98 per cent of all school-leavers). AIC students sit the IB exams, not NCEA.
McAuley High School has the best record at raising the achievement levels of its students. To take one of several measures: the weighted average over five years of all McAuley school-leavers who passed UE is 55.4 per cent, compared with 25 per cent for the other decile 1 schools).
Auckland Grammar School, Epsom Girls Grammar School and Macleans College are the standout state schools.
Baradene College, St Mary’s College and Carmel College are the best-performing Catholic schools.
GUIDE TO THE TABLE
The data in this table was sourced from the Ministry of Education and NZQA, and analysed by Metro.
OUR DATA
Official MoE data sets for 2014 were not available at press time. We asked all schools to supply their 2014 data. Most obliged, and we are grateful to them. To help with reliability, we allowed all schools to see the full draft data sets, so that they could verify their own and comment on others’ if they wished.
All achievement data (except Scholarship) is expressed as % of all school leavers. We believe school leaver data is the fairest and most accurate way to report whole-school achievement, without manipulation by schools.
Achievement data is based on MoE definitions: it applies to domestic students enrolled in a school for at least 70 days; and it excludes overseas students, short-stay students, “Alternative Education” students, adult ESOL students and other such special-needs students who are not in school to gain regular qualifications.
Data sourced from schools, Ministry of Education (educationcounts.govt.nz) and New Zealand Qualifications Authority (NZQA), and analysed by Metro.
1 SCHOOL
All secondary schools in greater Auckland are listed, except special needs, Maori immersion and religious schools with a very small roll.
2 NCEA PASS RATES
How to read the bar charts: The bigger the orange and yellow bars and the smaller the black and blue bars, the better the achievement of the school.
Use the bar charts to help you compare schools within decile groups and also not in the same groups (eg, see Orewa College and Edgewater College).
In graph form, we show the highest NCEA qualification (or equivalent — see below) gained by all school leavers, for the most recent year with data available to us.
IB diploma data is included in the level 3 data.
For schools offering the Cambridge (CIE) or International Baccalaureate (IB) exams, we have shown data for CIE and IB results that is “equivalent” to NCEA, according to an agreement between the Ministry of Education and CIE schools. They are:
NCEA level 1 = IGCSE, 4 passes (A* to D); or AS level, 1 pass.
NCEA level 2 = CIE AS level, 4 passes (A to E), or A2 level, 1 pass.
NCEA level 3 = CIE AS or A level, 7 passes (A* to E, incl 3 x D or better), or other recognised AS or A qualification, or A2 level, 3 passes. Data from MoE and schools.
3 EXAM TYPE
Schools that offer the Cambridge (CIE) or International Baccalaureate (IB) exams, as well as or instead of NCEA, are noted.
4 DECILE
We list the schools in decile groups that we judge should have comparable outcomes. We have separated private (independent) schools from other decile 10 schools as their academic performance is clearly different. We show the new 2015 deciles.
5 TYPE OF SCHOOL
For most students, Years 9-13 are the secondary school years. Several schools start at Year 7 and some start at Year 1 with new entrants. Some students stay in school until Year 15. Data from ERO.
Integ. = Integrated schools (mostly Catholic and other religious schools).
6 ROLL
We show the Years 9-13 roll at July 1, 2014 (except where the school is Year 11-13). These figures include all students and are given to indicate the size of the school. They do not reflect the exclusions we have based our data on (see Our Data above).
7 UNIVERSITY ENTRANCE
How to read the numbers: Four or five years’ data is given. The trend (up, static or down) is shown with an arrow. The Weighted Average is given, with the weighting favouring more recent results.
2010-2014 data: The % of all school leavers in each given year who had gained UE. Not all 2014 data available.
TR: Trend.
WA: Weighted Average.
ACG Sunderland, Albany Senior High and Ormiston are too new to have five years’ worth of data. Data from MoE and schools.
8 SCHOLARSHIP
The proportion of the Year 13 roll on July 1 that gained a Scholarship in 2014. The number of students who sit the exam before Year 13 is not statistically significant. Data from NZQA.
The table was sent to all schools for verification.