Sep 17, 2014 Schools
Click on image for full-size version. For notes to the table, see below.
LATEST: THE BEST SCHOOLS IN AUCKLAND 2015
Published in Metro, July 2014.
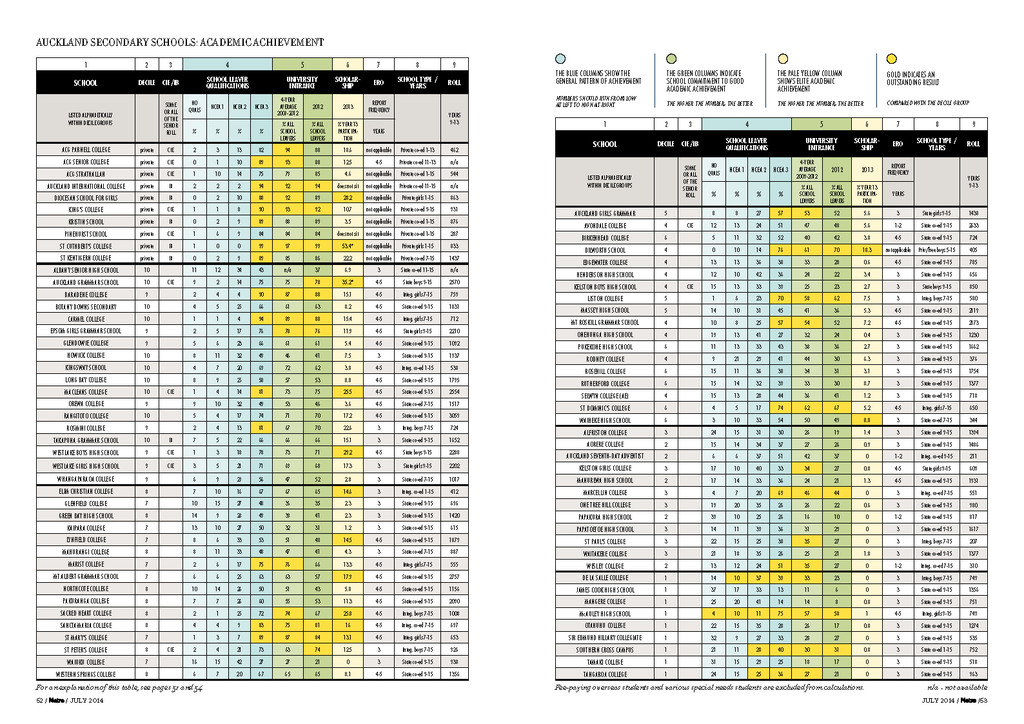
The table above gives a breakdown of academic results for high schools across the Auckland region. We haven’t ranked the schools, partly because we don’t think academic achievement should be considered on its own — although we do think it is vitally important. Partly also because, even when you’re looking just at academic achievement, it depends what you’re looking for. The best school for an intellectually gifted student who also excels on the sports field? The best for a kid who can kick and throw brilliantly but struggles with the times tables? The best for a child who achieves in the middle of the bunch and struggles to make friends? The best for someone who wants only to dance?
Here’s the thing. Most good schools will tell you they are the right school for all those students, and that’s very often right. It’s tempting, when choosing a school for a 12-year-old, to look for one that fits their personality and interests. That’s a mistake. Sad but true fact: whatever your 12-year-old is like now, they will almost certainly not be like that at 16. And whatever they do with their time (and whoever they like to do it with) is really not going to be what they do at 16.
The best school for your child is one that believes in an active home/school relationship. One where the kids like going to school, and the academic achievement levels are good (or better than good) for the decile group, and there is a range of opportunities in curricular and extra-curricular activities. And, above all that, where it strikes you there’s a very good principal and a bunch of very good teachers.
Our table is designed to help you identify candidates. It’s a conversation starter for those schools you know about or are interested in. Outstanding achievements are identified in gold.
The importance of University Entrance
If the table looks like a sea of numbers to you, focus on just one set: the two green columns showing University Entrance.
There are three reasons the University Entrance data is so valuable. The first is that it is universal: every student who leaves school is judged either to have reached or not reached this level. UE is not an exam, but is calculated in relation to passes in NCEA, the Cambridge system and the International Baccalaureat (IB). The relativities have been agreed among all the relevant parties, including the schools, the universities and the Ministry of Education.
The second value of our UE data is that it’s very hard to manipulate. This is because we show UE pass rates as a proportion of all school leavers, not just Year 13 as many schools may presuppose. This shows up any schools that encourage less-able students to leave before Year 13, rather than risk failing and thus dragging down the pass rates for the school.
The third value of our UE data concerns its wide relevance. Although 70 per cent of school leavers will not go to university, a good UE pass rate indicates that a school focuses on academic achievement among all students.
In the table, the first UE column is an average over four years. That’s your best overall guide. The second is the figure for the most recent year (2012). If the second is higher than the first, it suggests the school’s UE results are trending upward. If it’s lower, things might be getting worse. Read them together.
A word on deciles
As a rule, the higher a school’s decile, the more likely the kids are to do well academically. There are lots of arguments about why this is, but the simple fact of it is inescapable.
But deciles do not tell you how good a school is. Our table reveals that students at St Mary’s College in St Marys Bay are more than three times as likely to get UE as those at Waiuku College, although both schools are decile 7. Decile levels will tell you some things about the likely resources in a school, and may give you some clues to the nature of school trips and other “add-ons”. But they don’t have a lot to say about how good the teachers are or how well your child will prosper.
NCEA, Cambridge and IB
We don’t report pass rates for NCEA. We think NCEA is a good system that on the whole offers teachers and students a wealth of opportunity. But comparative scores are now very unreliable: pass rates are rising, there is more internal assessment, some schools are changing from achievement standards to unit standards, and many schools now report on the basis of participation rates, not roll rates, which we think is open to abuse.
We report achievement in these exams much the way we report UE: in relation to school leavers. Under “School Leaver Qualifications” in the blue columns in our table, we show the proportion of school leavers who had no qualifications when they left, and the proportions who had qualified at NCEA levels 1, 2 or 3. Good schools have a sequence of numbers that runs from low to high, left to right: very few students leave with nothing; lots get a high qualification. This pattern is evident for the best schools in all deciles.
Outstanding? Check out Carmel College in Milford: 94 per cent gained NCEA level 3 and almost nobody left without at least level 2. In the mid-deciles, Dilworth, a school in Epsom run by a charitable trust, sets the pace, and St Dominic’s in Henderson runs it close — as does decile 1 McAuley High School, a Catholic girls’ school in Otahuhu. McAuley is a phenomenon: its NCEA pass rates compare closely with decile 7 Marist College in Mt Albert, and Marist itself is a good school.
There’s another pattern in these results: most of these outstanding schools are Catholic. Why? There is no single reason, but we believe one strong factor is the built-in integration of school and family established by the church. Other schools can achieve that integration too, but they have to work harder at it.
At Kelston Boys, principal Brian Evans tells us they had an NCEA level 2 pass rate in 2010 somewhere in the mid-50s. Our table now shows 72 per cent of school leavers with that level or better. Evans, clearly an inspirational principal, was formerly at De La Salle College, and presumably has applied to his state school much of what he knows works at the Catholic one.
Several very low decile schools argue level 2 is their realistic target for most students, because this is usually the minimum for a pathway into trade training.
At the top and the bottom
Scholarship, a Year 13 exam, provides a good measure of elite academic achievement, although there are some anomalies to note. Scholarship fits well with NCEA, both in the approach to the curriculum and the timing of exams, but can be harder to dovetail with Cambridge and IB. For that reason, some otherwise high-performing schools (like King’s College) have fewer students than you might expect sitting it. However, many Cambridge and IB schools commit to Scholarship and do very well. (Auckland International College, whose academic year is geared to the Northern Hemisphere, doesn’t offer Scholarship.)
St Cuthbert’s College in Epsom deserves special mention: it’s an IB school, yet it gained 93 Scholarships last year: that’s equivalent to 53 per cent of the Year 13 roll. The next best result was at Auckland Grammar, with 35 per cent, followed by Westlake Boys High in Forrest Hill on the North Shore, Diocesan School for Girls in Epsom, Sacred Heart in Glendowie and Macleans College in the eastern suburb of Bucklands Beach.
Some mid- and low-decile schools regularly show up in the Scholarship lists — while their most able students may not be learning in a Cuthbertian environment, they are clearly getting the support they need. Dilworth, again, was the standout last year, and among decile 1-3 schools, it’s notable that almost half tasted Scholarship success.
It’s dangerous to gauge the worth of a school on Scholarship alone. Some schools focus their best teachers and other resources on the elite, so others miss out. Our table identifies schools with an unusual disparity between the achievements of the elite and those of the rest. They include Alfriston, Mangere, One Tree Hill, Otahuhu and Waitakere, where despite some Scholarship success, around 40 per cent of students left school without gaining NCEA level 2. We identified this problem in most of these schools last year, but the pattern has not changed.
Then there are the outright failures. Papakura High, which does not even have the excuse of being decile 1, let 49 per cent of its students leave school without achieving NCEA level 2 — the generally accepted minimum for a pathway to further training. And at James Cook High School in Manurewa, it was 54 per cent. Over half of all James Cook’s school leavers failed, while a mere six per cent gained UE — that’s barely a quarter of the average for decile 1. On this data, James Cook is the worst-performing school in Auckland.
GUIDE TO THE TABLE
The data in this table was sourced from the Ministry of Education and NZQA, and analysed by Metro.
The achievement data excludes fee-paying overseas students, “Alternative Education” students, adult ESOL students and others who are not chasing regular qualifications.
The table was sent to all schools for verification.
1 SCHOOL
We list secondary schools in greater Auckland with a roll size in Years 9-15 above 200. A dozen or so smaller schools are not listed. Ormiston College is too new to be listed. Schools are listed alphabetically within decile groups (see 2 below).
2 DECILE
Most private (independent) schools are designated decile 10, but we have separated them from other decile 10 schools in our analysis as their academic performance – for disputed reasons – is clearly different. We list the schools in decile groups: groups we judge should have comparable outcomes.
3 CIE / IB
Schools offering the Cambridge (CIE) or International Baccalaureat (IB) exams, as well as or instead of NCEA, for all or a part of their senior school roll, are noted.
In the data under 4 below, we have shown data for CIE and IB results that is judged by the Ministry of Education to be “equivalent” to NCEA:
NCEA level 1 = IGCSE, 4 passes (A* to D); or AS level, 1 pass.
NCEA level 2 = CIE AS level, 4 passes (A to E), or A2 level, 1 pass.
NCEA level 3 (in general) = CIE AS or A level, 7 passes (A* to E, incl 3 x D or better), or other recognised AS or A qualification, or A2 level, 3 passes. (This level generally equates to UE.)
These equivalents have been agreed between the Ministry of Education and the New Zealand schools CIE group, although they are under review.
IB diploma is included in the level 3 data: it is gained after two years and is at least equivalent to NCEA at this level.
4 SCHOOL LEAVER QUALIFICATIONS
Based on the most recent available data from the Ministry of Education (2012). We show the highest level of NCEA (or its CIE or IB equivalent qualifications) reached by school leavers, as a proportion of all school leavers. For Scholarship results, see 6 below. For schools that offer CIE or IB exams, see 3 above.
5 UNIVERSITY ENTRANCE
The first column shows the proportion of all school leavers who had gained UE by the time they left school, averaged over four years (2009-2012). The second column shows the same data for the most recent year we can report (2012). This is the latest available data from the ministry.
6 SCHOLARSHIP
The number of Scholarships gained, expressed as a proportion of the Year 13 roll on July 1, 2013. The number of Scholarships gained before Year 13 is not statistically significant. Data from the New Zealand Qualifications Authority (NZQA).
7 ERO VISITS
Most schools are assessed by the Education Review Office (ERO) every three years. Where ERO visits every 1-2 years, the school’s performance is probably regarded as “poor”. A visit every 4-5 years means ERO regards the school as “exceptional”. Data from ERO.
8 SCHOOL TYPE / YEARS
For most students, Years 9-13 are the secondary school years. Some schools start at Year 7 and some start at Year 1. Some students may spend a year or two longer at school, which is why most schools officially have a roll up to Year 15. Data from ERO.
Integ. = Integrated schools (mostly Catholic schools and others with a religious character).
9 ROLL
We show the Years 9-13 roll at July 1, 2013. These figures include all students and are given to indicate the size of the school. They are not the roll figures our achievement data is based on (see note above, at start of guide).
Data collection by Catherine McGregor and Don Rowe.